Competitions
CAT Prep
Upskill
Placements
MBA Co'26
RTI Response
Rankings
Score Vs. %ile
Salaries
Campus Tour

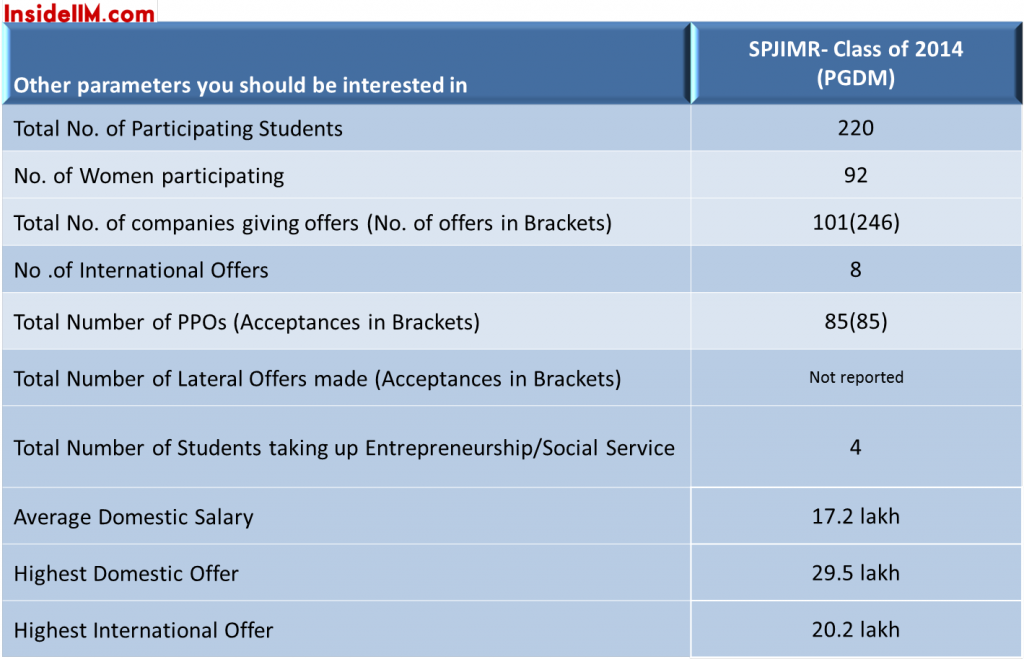
Final Placements: SPJIMR Mumbai - Class of 2014

Comments
 

Abhisek Kabiraj

Any way to know the Branch specific placements..... for example for operations we have Bristlecone and other SCM roles but what about the rest of the batch.... do they take up roles from other domains

9 Apr 2014, 12.14 PM

+Read Replies (1)

Phanindra Telukunta

contact any sp alum for this info

10 Apr 2014, 02.50 PM |

HARI HARAN

Please post placement report of NITIE.

11 Apr 2014, 09.08 AM

null null

17.2 lacs average lol :P even IPRS reports are inflated it seems wtf

11 Apr 2014, 10.49 AM

+Read Replies (3)

atul mishra

@pksingh3232 If you think IPRS reports are inflated then please read the way audits work. If you dont wanna believe its your choice, but trying to belittle our steps to be transparent will not make your institute look ccol. @retro Yes we reported good placement figure when every college took dip but is that so improbable that you guys find it impossible to believe. Last year our batch size was 180+, this year we are 220 with all the students divided in 4 specializations equally. Our internship happens in Sep of second year when we have studied about our specialization, naturally our PPO conversion will be good. We have taken a different path but that does not mean we can not perform better. All I am saying is be a little more open minded and if you doubt the credibility of IPRS then all what I am saying will not even matter to you ppl

12 Apr 2014, 06.33 PM |

GAURAV Gupta

@avatarang SP Jain has not published any placement report as per IPRS since 2013. If in any case SP Jain has no intention of inflating thier average figures first ask your college authorities to publish placement report as per IPRS format for year 2013 and 2014.

16 Apr 2014, 03.04 AM |

Mudit Srivastava

The reported CTC is 17.2lpa. The audited MEP (Maximum earning potential which includes logn term benefits and bonuses) is 14.65 lpa http://www.iimahd.ernet.in/iprs/gallery/IPRS_SPJIMR_PGDM_Finals_2014.pdf hence one can see the extent to which the avg pckg is hiked

25 Mar 2015, 02.18 PM |

Rahul Saini

Ha Ha 17.2 lac average!!! We know the inside story of every B-School ....SPJAIN reported 16 l around last year when every college had a dip in the average... going by the trend...it had to increase it a little this year too ...so there it goes 17.2 IPRS zindabad lol

12 Apr 2014, 02.36 PM

+Read Replies (2)

Poojan Shah

@Retro - XLRI: Batch Size - 245, Median Salary 16.25 [Src - InsideIIM report] FMS: Batch Size - 220, Avg Salary 16.18 (Top 50% avg of 19 lpa) [Src - Placement Report on website] JBIMS: Batch Size - 120, Avg Salary 16.18 lpa [Src - Article of careers360] IIMI: Batch Size - 475, Avg for Top 200 is 16.47 and overall 12.13 [Src - InsideIIM report] (I have my reservations on considering this top 200 figure but since its a bschool comparable to SPJIMR I have included it) SPJIMR: Batch Size - 220, Median Salary of 16.8 and Avg of 17.2 [Src - Placement report on website] Now if you compare these figures 16.85 isn't very high when you have top 50% at FMS above 19. You have also gotta understand these figures include multiple parameters and actual cash in hand would be much different from what the salary is mentioned. P.S - Salaries are important but I still believe its profiles which matter the most and it would be great if all the students and aspirants understand this. This is gonna be last step in education for all and one is not gonna get many opportunities of switching domain after completing MBA, so as long as the students are getting profiles of their liking salaries aren't a very major issue. IIMA has been doing by reporting only profiles and I believe its high time every bschool goes that way. And the one who are analyzing the reports too should focus on roles more than salaries.

13 Apr 2014, 04.33 PM |

Rahul Saini

poojan ... its not 16.85, its 17.2 do not compare a median with an average. And you think 17.2 is comparable to 16ishs?? Why don't you point out few companies which have made offers at SPJIMR which do not visit the likes of XLRI and FMS which would make the figure of 17.2 against 16.2s believable. The point is what makes SPJIMR report higher salaries than the likes of XLRI and FMS? There has to be some differentiating factor, or do you mean to say the companies visiting SPJIMR generally offer more than the companies visiting other similar colleges? This whole placement reporting thing is goofed up. B-Schools report exhorbidant average salaries which are in no way matched with the reality. This slight anomaly in one B-School report actually exposes their follies.

16 Apr 2014, 08.03 PM |

Shivam Atri

17.2 lolz...

29 Jun 2014, 11.00 AM

Mudit Srivastava

For the class of 2013 the college released an Avg of 16.13 lpa (http://insideiim.com/final-placements-spjimr-mumbai-class-of-2013-unverified-report/) After the audit, the avg MEP (max earning potential) came out to be 14.3 lpa (http://www.iimahd.ernet.in/iprs/gallery/IPRS_SPJIMR_PGDM_Finals_2013.pdf). So we can see the averages reported are way higher than even the MEP. (For reference of actual salary: the avg "total guaranteed cash component" (which includes joining bonus) is 12.09 lpa and the avg of "fixed yearly salary" is 11.02 lpa for that year. This gives an idea how the actual cash salaries compare to the CTCs reported (compare 11.02 with 16.13 !). And even further, the "in hand" salary would be obtained after deducting Tax, PF and other deductibles from this 11.02 (which may come out to around 8 lpa!) . To comment on the inflated figures, in a nushell : Reported Avg CTC 16.13 lpa >> In hand avg salary 8 lpa. (P.S. there are lesser data points in the audited report for the second argument but nonetheless an approx idea may be obtained from it.)

21 Sep 2014, 01.13 AM

Mudit Srivastava

The reported CTC is 17.2lpa. The audited MEP (Maximum earning potential which includes logn term benefits and bonuses) is 14.65 lpa http://www.iimahd.ernet.in/iprs/gallery/IPRS_SPJIMR_PGDM_Finals_2014.pdf hence one can see the extent to which the avg pckg is hiked

15 Feb 2015, 01.20 AM

Mini Mock Test

1 Day to CAT 2024 (All the best)

Participants: 33

Final 2 Days to CAT 2024 Test-44

Participants: 382
College Comparison Tool - Quiz Ad

Final 3 Days to CAT 2024 Test-43

Participants: 319

Final 4 Days to CAT 2024 Test-42

Participants: 355

Final 5 Days to CAT 2024 Test-41

Participants: 372

Final 6 Days to CAT 2024 Test-40

Participants: 351

Final 7 Days to CAT 2024 Test-39

Participants: 345

Final 8 Days to CAT 2024 Test-38

Participants: 317

Final 9 Days to CAT 2024 Test-37

Participants: 328

Final 10 Days to CAT 2024 Test-36

Participants: 290

Final 11 Days to CAT 2024 Test-35

Participants: 508

Final 12 Days to CAT 2024 Test-34

Participants: 336

Final 13 Days to CAT 2024 Test-33

Participants: 298

Final 14 Days to CAT 2024 Test-32

Participants: 279

Final 15 Days to CAT 2024 Test-31

Participants: 367

Final 16 Days to CAT 2024 Test-30

Participants: 298

Final 17 Days to CAT 2024 Test-29

Participants: 312

Final 18 Days to CAT 2024 Test-28

Participants: 343

Final 19 Days to CAT 2024 Test-26

Participants: 338

Final 20 Days to CAT 2024 Test-26

Participants: 307

Final 21 Days to CAT 2024 Test-25

Participants: 253

Final 22 Days to CAT 2024 Test-24

Participants: 268

Final 23 Days to CAT 2024 Test-23

Participants: 180

Final 24 Days to CAT 2024 Test-22

Participants: 227

Final 25 Days to CAT 2024 Test-21

Participants: 226

Final 26 Days to CAT 2024 Test-20

Participants: 278

Final 27 Days to CAT 2024 Test-19

Participants: 233

Final 28 Days to CAT 2024 Test-18

Participants: 235

Final 29 Days to CAT 2024 Test-17

Participants: 247

Final 30 Days to CAT 2024 Test-16

Participants: 284

Take Free Test Here

Comments
 

Abhisek Kabiraj

Any way to know the Branch specific placements..... for example for operations we have Bristlecone and other SCM roles but what about the rest of the batch.... do they take up roles from other domains

9 Apr 2014, 12.14 PM

+Read Replies (1)

Phanindra Telukunta

contact any sp alum for this info

10 Apr 2014, 02.50 PM |

HARI HARAN

Please post placement report of NITIE.

11 Apr 2014, 09.08 AM

null null

17.2 lacs average lol :P even IPRS reports are inflated it seems wtf

11 Apr 2014, 10.49 AM

+Read Replies (3)

atul mishra

@pksingh3232 If you think IPRS reports are inflated then please read the way audits work. If you dont wanna believe its your choice, but trying to belittle our steps to be transparent will not make your institute look ccol. @retro Yes we reported good placement figure when every college took dip but is that so improbable that you guys find it impossible to believe. Last year our batch size was 180+, this year we are 220 with all the students divided in 4 specializations equally. Our internship happens in Sep of second year when we have studied about our specialization, naturally our PPO conversion will be good. We have taken a different path but that does not mean we can not perform better. All I am saying is be a little more open minded and if you doubt the credibility of IPRS then all what I am saying will not even matter to you ppl

12 Apr 2014, 06.33 PM |

GAURAV Gupta

@avatarang SP Jain has not published any placement report as per IPRS since 2013. If in any case SP Jain has no intention of inflating thier average figures first ask your college authorities to publish placement report as per IPRS format for year 2013 and 2014.

16 Apr 2014, 03.04 AM |

Mudit Srivastava

The reported CTC is 17.2lpa. The audited MEP (Maximum earning potential which includes logn term benefits and bonuses) is 14.65 lpa http://www.iimahd.ernet.in/iprs/gallery/IPRS_SPJIMR_PGDM_Finals_2014.pdf hence one can see the extent to which the avg pckg is hiked

25 Mar 2015, 02.18 PM |

Rahul Saini

Ha Ha 17.2 lac average!!! We know the inside story of every B-School ....SPJAIN reported 16 l around last year when every college had a dip in the average... going by the trend...it had to increase it a little this year too ...so there it goes 17.2 IPRS zindabad lol

12 Apr 2014, 02.36 PM

+Read Replies (2)

Poojan Shah

@Retro - XLRI: Batch Size - 245, Median Salary 16.25 [Src - InsideIIM report] FMS: Batch Size - 220, Avg Salary 16.18 (Top 50% avg of 19 lpa) [Src - Placement Report on website] JBIMS: Batch Size - 120, Avg Salary 16.18 lpa [Src - Article of careers360] IIMI: Batch Size - 475, Avg for Top 200 is 16.47 and overall 12.13 [Src - InsideIIM report] (I have my reservations on considering this top 200 figure but since its a bschool comparable to SPJIMR I have included it) SPJIMR: Batch Size - 220, Median Salary of 16.8 and Avg of 17.2 [Src - Placement report on website] Now if you compare these figures 16.85 isn't very high when you have top 50% at FMS above 19. You have also gotta understand these figures include multiple parameters and actual cash in hand would be much different from what the salary is mentioned. P.S - Salaries are important but I still believe its profiles which matter the most and it would be great if all the students and aspirants understand this. This is gonna be last step in education for all and one is not gonna get many opportunities of switching domain after completing MBA, so as long as the students are getting profiles of their liking salaries aren't a very major issue. IIMA has been doing by reporting only profiles and I believe its high time every bschool goes that way. And the one who are analyzing the reports too should focus on roles more than salaries.

13 Apr 2014, 04.33 PM |

Rahul Saini

poojan ... its not 16.85, its 17.2 do not compare a median with an average. And you think 17.2 is comparable to 16ishs?? Why don't you point out few companies which have made offers at SPJIMR which do not visit the likes of XLRI and FMS which would make the figure of 17.2 against 16.2s believable. The point is what makes SPJIMR report higher salaries than the likes of XLRI and FMS? There has to be some differentiating factor, or do you mean to say the companies visiting SPJIMR generally offer more than the companies visiting other similar colleges? This whole placement reporting thing is goofed up. B-Schools report exhorbidant average salaries which are in no way matched with the reality. This slight anomaly in one B-School report actually exposes their follies.

16 Apr 2014, 08.03 PM |

Shivam Atri

17.2 lolz...

29 Jun 2014, 11.00 AM

Mudit Srivastava

For the class of 2013 the college released an Avg of 16.13 lpa (http://insideiim.com/final-placements-spjimr-mumbai-class-of-2013-unverified-report/) After the audit, the avg MEP (max earning potential) came out to be 14.3 lpa (http://www.iimahd.ernet.in/iprs/gallery/IPRS_SPJIMR_PGDM_Finals_2013.pdf). So we can see the averages reported are way higher than even the MEP. (For reference of actual salary: the avg "total guaranteed cash component" (which includes joining bonus) is 12.09 lpa and the avg of "fixed yearly salary" is 11.02 lpa for that year. This gives an idea how the actual cash salaries compare to the CTCs reported (compare 11.02 with 16.13 !). And even further, the "in hand" salary would be obtained after deducting Tax, PF and other deductibles from this 11.02 (which may come out to around 8 lpa!) . To comment on the inflated figures, in a nushell : Reported Avg CTC 16.13 lpa >> In hand avg salary 8 lpa. (P.S. there are lesser data points in the audited report for the second argument but nonetheless an approx idea may be obtained from it.)

21 Sep 2014, 01.13 AM

Mudit Srivastava

The reported CTC is 17.2lpa. The audited MEP (Maximum earning potential which includes logn term benefits and bonuses) is 14.65 lpa http://www.iimahd.ernet.in/iprs/gallery/IPRS_SPJIMR_PGDM_Finals_2014.pdf hence one can see the extent to which the avg pckg is hiked

15 Feb 2015, 01.20 AM