This is the fifth edition of annual Alumni Report on InsideIIM.com. This is the part one of this year's edition.
To check out last year's edition, please click
here.
So let's get to business. No. Wait. Let's get to the Alumni.
In this Annual Report, we research, record, and assess the distribution of alumni from top 16 b-schools in India across some of the dream companies across sectors - Consumer Goods, Banking & Finance, E-Commerce and Technology, and Consulting. We will look at absolute numbers of alumni in each company and compare percentages of alumni in 2 ways –
- Which school has the highest representation of a company among its ‘peers’ and
- Which company has the highest percentage of alumni for a given business school.
(Peers are defined based on the year of establishment of the business school. More details below.)
Why do we create this report every year?
1) To help potential aspirants know about a business school’s reputation in the corporate world – alumni stats are a good indicator – both number, as well as diversity, is important.
2) It helps current students and alumni get an overall picture of their own alumni and facilitates more targeted networking
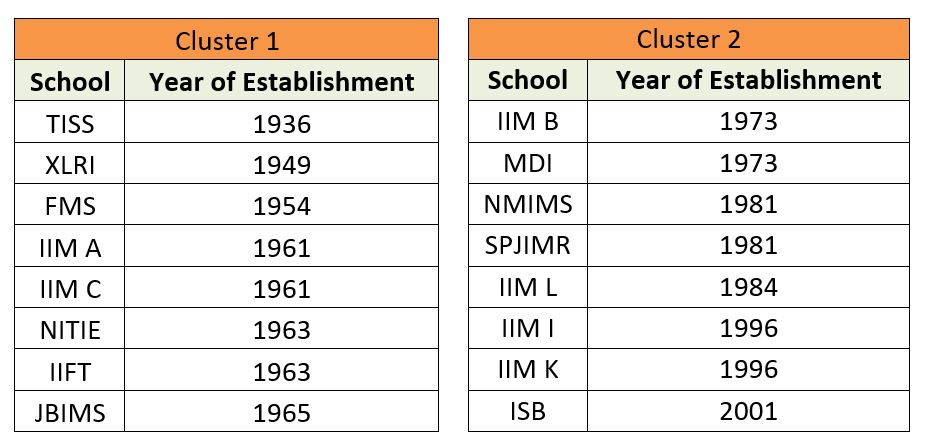
Creation of 2 Business School Clusters – Pre 1966 and Post 1966
Top B-schools in India are divided into two categories based on the years in which they were established. The rationale behind such a selection criterion is to ensure that the alum base is strong and comparable for the B-schools under consideration. As there was no top B-school established between 1965 and 1973, the cut-off year chosen for dividing the schools is taken to be 1965. This criterion divides the schools into two clusters – Cluster 1 – Pre-1966 and Cluster 2 – Post-1966 – having 8 schools in each cluster.
The table summarises these clusters with the year of establishment
Analysis of Alumni in Consumer Goods Companies:
A total of 17 companies were considered for obtaining a holistic picture of alumni of b-schools working in any of the domains. The list of companies is considered to be a comprehensive representation of the popular recruiters across the various top b-schools.
The Pre 1966 Top Business Schools
Given below is the raw data from LinkedIn for the 8 Schools in this cluster of schools established prior to 1966. Please note that –
1) No filtration has been done for job profile. Hence, the figures below represent every role and domain – the numbers below include Alumni in Sales & Marketing, Operations, IT, Corporate Finance, HR and other domains.
2) All possible business of a sales and marketing company have been considered. For e.g. – HUL below consists of employees from Hindustan Unilever, Unilever etc. Cadbury includes employees from both Cadbury and Mondelez International.
The Pre 1966 Top Business Schools
Given below is the raw data from LinkedIn for the 8 Schools in this cluster of schools established prior to 1966.
Limitations of the report :
1) No filtration has been done for job profile and hence it represents every function from Investment Banking to Technology to HR to operations. The salaries of those in different functions in the same bank are different – For e.g. Someone in Banking operations at Citibank is paid differently from someone who is a relationship manager. Unfortunately, that cannot be accurately gauged from LinkedIn data.
2) All the possible businesses of a company have been considered. For eg. Barclays includes Barclays Investment Bank, Barclays Wealth and Investment and Barclays Corporate Banking.
3) Prima facie, it may seem that a larger number of alumni determines the strength of the b-school. However, the quality of roles offered plays an extremely important part in understanding placements and the quality of the alum base of the respective b-school. For e.g. There is a substantial difference between working in a front-end investment banking role and working in a KPO. These points are not illustrated in these reports owing to the subjectivity involved.
The analysis done below gives a detailed look into:
– Company wise slicing of Alumni across Category 1 b-schools.
– Cumulative percentage of alumni working in different companies.
% of Alumni in each Company from each of the 8 Top Schools established prior to 1966
Reference: Percentage of Alumni crossing 20% has been marked red.
Key Takeaways
- Specialisation in b-school helps. For instance, in the above table, alums of NITIE (Mecca of Supply Chain) dominate most of the FMCG Companies. Next, the HR program of XLRI has grown to be one of the best the country has to offer. Clearly, the dominance in HR is established in the FMCG companies.
- The top recruiters for these schools are HUL, P&G, ITC, J&J and Nestle.
- IIFT, JBIMS and TISS are under-represented compared to other business schools.
% of Total Alumni from each of the 8 Top Schools established prior to 1966 – in each company
Reference: Percentage of Alumni crossing 18% has been marked red.
Key Takeaways:
- JBIMS has always been represented well in the HUL companies.
- Beyond, HUL , P&G and ITC, most of the b-schools haven't expanded much. Except, the presence of Nestle in IIM C.
- XLRI enjoys a good distribution across companies.
The Post 1966 Top Business Schools
Given below is the raw data from LinkedIn for the 8 Schools in this cluster of schools established prior to 1966. Please note that
1) No filtration has been done for job profile. Hence, the figures below represent every role and domain – the numbers below include Alumni in Sales & Marketing, Operations, IT, Corporate Finance, HR and other domains.
2) All possible business of a sales and marketing company have been considered. For e.g. – HUL below consists of employees from Hindustan Unilever, Unilever etc. Cadbury includes employees from both Cadbury and Mondelez International.
3)
NMIMS also has many undergrad degrees. The figures for NMIMS could be influenced heavily because of this as B.Com, BBA, B.Sc. Eco grads are also counted along with the post-grad MBA. Also, we have seen many examples of Narsee Monjee College of Commerce and Economics grad label themselves under NMIMS by mistake on LinkedIn.
% of Alumni in each Company from each of the 8 Top Schools established after 1966
Reference: Percentage of Alumni crossing 20% has been marked red.
Key Takeaways:
- NMIMS has a strong foothold in most of the companies; especially, Colgate-Palmolive, Asian Paints, Castrol, Brittania, and GSK. Location, Batch Size, and the presence of Undergrad Degree Courses may be the advantage here.
- Like last year, Reckitt Benckiser has a special preference for towards IIM L and MDI, with both the schools representing 46% (decreased from 67% last year) of the total from the 8 schools.
- L'Oreal and ITC maintain a good distribution across 8 schools.
- The top recruiters in this set of schools are: HUL, P&G, Asian Paints and ITC.
% of Total Alumni from each of the 8 Top Schools established after 1966 – in each company
Reference: Percentage of Alumni crossing 18% has been marked red.
Key Takeaways:
- As seen last year, HUL forms a huge part of the alumni base in this sector for almost all of the 8 b-schools except MDI.
- IIM Bangalore, as well as SPJIMR have an impressive presence across companies.
- IIM Indore and IIM Kozhikode have the least number of alumni across these companies.
You can check last year's reports
here.