Revenues
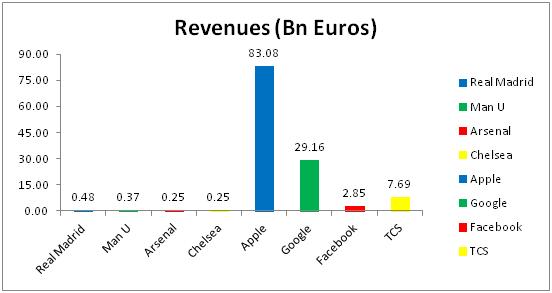
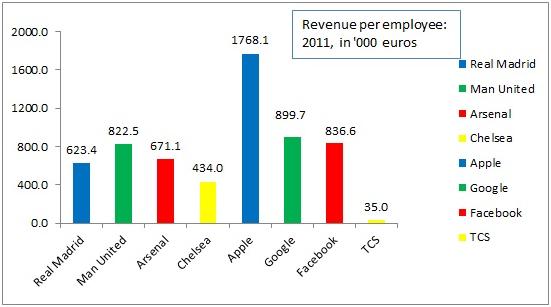
In the last post, a comparison of Real Madrid’s revenues with corporate giants made club football look like a cottage industry. However, we hadn't looked at Revenue per employee and now that we have the data, we find that the big clubs do redeem themselves.


In revenues per employee, the comparison with Apple is misleading and should be omitted. This is because Apple, in its operations, behaves like a design company– they design ipads whose components are actually manufactured by ARM, Samsung etc. and assembled by Foxconn in China. The people in the Chinese sweatshops aren’t being counted as employees of Apple, but their contribution is being reflected in Apple’s revenues. The revenue per employee, is therefore, artificially inflated.
The best peers for comparing football clubs would be software companies – where (
alert: HRspeak) employees are the only assets. Real Madrid, Man U, Arsenal and Chelsea are extremely productive organisations, especially considering the fact that at around 20-25% of the employees are caterers and cleaners – a function that could easily be outsourced. (Real Madrid has 770 employees, Man around 450, Arsenal around 380 and Chelsea around 580).
Wages
We first look at average player earnings (pre-tax) at the top football clubs- (data - ESPN/SportingIntelligence global survey - here)
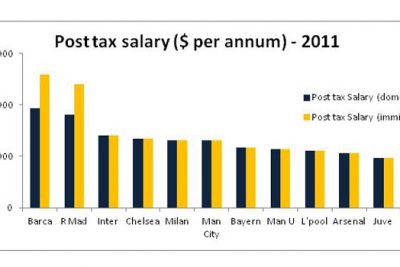
The Spanish duo tops this list as well. Considering the kind of revenues they generate, they can afford to pay such handsome wages. An interesting variation would be to consider post tax salaries for domestic and immigrant players. The tax rates (maximum) that apply to domestic and immigrant footballers is given below:-
- Spain, Netherlands and France have a policy of charging lower taxes on foreign footballers.
- Spain also has the lowest tax rates among all these countries, for both, domestic and foreign footballers. This explains why its football is doing so well and why its economy is in the doldrums.
- Despite having the highest taxes, Portugal is a country that has failed to on both counts- football AND economy.
Now, you might observe the following :
- The gap between the earnings of Barca/Real Madrid players and the earnings of everybody else just increases because of lower taxes in Spain. The math is simple– to match a salary of a salary of 1,40,000 pounds a week at Barcelona at a 35% tax rate, Man U will have to offer 2,00,000 pounds a week at England's 55% tax rate. In terms of quality of football and quality of earnings, Spain is the best place to play.
- Inter and AC Milan have moved up one and two places respectively (compared to the pre-tax graph). This is because of the lower tax rate in Italy (53.4%) as compared to England (55.2%) and Germany (59%). This is also one of the main reasons the Wesley Sneijder transfer from Inter to Man U didn’t materialize. When the media reported that his wage demands were exorbitant, they knew he was talking about post-tax wages.
Wages – Balancing the Budget
The earlier section was from the viewpoint of the players. This section looks at wages through the eyes of the club’s administration. The ratio to be considered is wages to revenue. 'Wages' now includes wages to coaching staff etc. UEFA Fair Play Regulations have mandated that all clubs should have a wages to turnover ratio of less than 70%. Those clubs whose wages-to-revenue ratio is 70% or above, I have colour-coded in red. (data - swiss ramble blog)
- Manchester City’s wage bill had ballooned even before they started winning. Their ratio is a staggering 114%.
- All three Italian clubs are in the red zone. To summarize, their main problems are:
- On the revenues side, all three clubs are heavily reliant on broadcast money. Matchday revenues are measly for all three and only AC Milan has decent sponsorship and merchandizing revenues (66% more than both the others). Unless the other two revenue streams are tapped, there won’t be much overall revenue growth.
- On the costs side, the clubs are ready to splurge in search of glory without worrying about budgets (all three are owned by influential businessmen- Massimo Moratti, Silvio Berlusconi and the Agnelli family own Inter, Milan and Juve)
- But, they end up buying washed up stars and holding on to old warhorses, all at high wages. The average age of AC Milan is 29.4. The English club in this list with the highest average age is Chelsea – 27.6.
- Chelsea and Liverpool are on the borderline – Chelsea because of high wages to fading stars, and Liverpool because they don’t have enough revenues.
- The other clubs won’t have too much trouble adjusting to UEFA’s new regulations, either because of high revenues (Man U, Real Madrid and Barca), or cost-control (Arsenal) or both (Bayern).
A common feature of all the clubs that have a wages/turnover ratio over 70% is that they are owned privately by a wealthy businessman.
Transfers
Transfer spending is the most glamorous part of football finances. Mainly because the sums involved are astounding. Let’s look at transfer spending over the last three years. (Data source: Transfermarkt.com)
Man City’s leadership needs no explanation.
- Real Madrid are up there mainly because of the record busting acquisitions of Kaka (60 mn Euro) and C. Ronaldo (94 mn Euro) in 2010.
- Contrary to popular belief, Barcelona does buy from the transfer market to polish the flaws in the team. They splashed out 70 mn euro for Ibrahimovic in 2010, 40 mn euro on David Villa in 2011 and a total 60 mn Euro on Fabregas and Alexis Sanchez.
- Chelsea and Liverpool have made famous, costly and unproductive acquisitions (Torres, David Luiz) and (Andy Carroll).
The presence of teams like Juve so high in the list seems to be a mystery. This will be clearer when we look at the data more closely. Now, let’s look at the number of acquisitions in these three years and the average ticket size (data: transfermarkt.com).
- Barca has made just 10 acquisitions in the last three years, but they have the highest average ticket size. When they spend, they really break the bank – the spend 24.55 mn euro to be precise. Since theirs is already a smoothly-running machine, they just make blue chip acquisitions like David Villa, Fabregas and the like.
- Real and Man City both have nearly the same ticket size (21.3 mn euro), but Man City has made one more acquisition – which accounts for the difference of 20 mn euros in their total transfer spending.
- Italian clubs have always had miserly defences. They’ve now carried that reputation over to the transfer market. Italian clubs have made the largest number of acquisitions but they have the smallest average ticket size. That’s why they go under the radar of the transfer market. Juve, for example, made 34 acquisitions.
So you decide which is the most active club on the transfer market. Juve and co? Or Man City, Real Madrid etc.? Based on the last two graphs, I’d say it is Man City, Real Madrid, Barcelona and Chelsea who are the real market movers. These are the four clubs that have, for various reasons, the power to buy whatever they want.
I’ll look at debts etc. in the next part.
Part 1 can be accessed
here
- (Shyam Sunder Ramakrishnan)
The author is an alumnus of IIM Indore, batch of 2011 and currently works for Institutional Investor Advisory Services – a startup in the financial services industry.
Also Read:
Articles in our
Knowledge Cafe
Insights@InsideIIM :
A must read section for any management education aspirants, current students or recruiters
New ! – Industry Series :
Interview with Rishiraj Singh Pruthi – Head, Customer Marketing at Abbot Nutrition
Interview with Ravishankar Iyer: Building vocational skills for India Tomorrow
Our facebook page :
InsideIIM
Follow us on twitter here :
@InsideIIM


