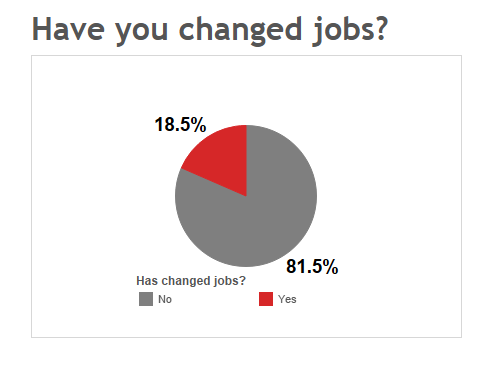
With 18 months having passed after graduation of the class of 2012, we thought it might be a good time to ask – What percentage of graduates from the batch of 2012 has changed their jobs. Generally it takes a little over a year for graduates to assess their career prospects with the jobs they got placed into. The number of job changes within an eighteen month time frame, therefore, gives us an estimate of a number of things:

1. Matching of expectations in profiles and companies
2. Changes in preference across domains and sectors
3. Dynamism of the overall job market
We had done this study last year, using a simple, free gift (aka LinkedIn). There are only a couple of small problems, one being fake profiles (easily weeded out) and another being delay in updating profiles (nothing much we can do here).
What’s different from last year’s study: This year we added three schools – MDI Gurgaon, ISB and NITIE. This along with the expansion in batch sizes means that our sample size is over 500 (as compared to 300 odd in last year’s survey) and the overall population is close to 4200 (as compared to 2500 in last year’s report).
Methodology: We went through over 500 randomly selected LinkedIn profiles in detail from the schools in India that we feature. The sample included the following schools: IIM ABCLIK, ISB, XLRI, SPJIMR, FMS, JBIMS, NITIE and MDI Gurgaon. We ensured there was proportionate representation of women and there was proportion in the number of profiles from all the different business schools. The following formula was used to reach the final estimates

Where,
n = the sample size, which, in random sampling, is fixed before the sample is taken, and
p = proportion of the measure in the sample
f = fraction of the total population sampled.
SE = Standard Error of estimated prevalence
We can indicate how precise we believe the estimate to be by constructing a confidence interval. For example, a 95% confidence interval for the true prevalence would be given by:
Estimated prevalence ± 1.96 x standard error of the estimate
The details of our dataset are given in the graph below:
 Results:
 15.5 -21.5% of graduates from the class of 2012 changed jobs within 18 months after graduation. (this number is likelier to be an underestimate because people normally take a while to update their linked in profiles).
This percentage is higher than the figure we arrived at for the class of 2011 (11-17%).
Our interpretation:
1.
Batch size increase contributed to the increase in job switches: The class of 2012 witnessed the commencement of an increase in batch sizes across IIMs and many other schools. An expansion in batch size usually results in a deterioration of the average job quality (especially when the job market is not exactly thriving). It increases the difficulty of matching expectations of candidates with job profiles during placement. This led to an increase in the number of people leaving their jobs soon after joining them from placements. In some ways, the batch of 2011 actually had the best placement year among the last five years (2009, 2010, 2011, 2012 and 2013).
2.
Start-ups are hiring: Although the overall hiring scenario has been bleak, start-ups have been hiring – our data below will show that several candidates have changed domains and entered technology startups like Flipkart, Ibibo etc.
From what domain are most graduates changing jobs?
As seen from the graph above, IT consulting has had the greatest number of job changes. Please bear in mind that the graph only indicates the number of people in the domain who changed their jobs, it does not imply that they changed domains. E.g. If a person changed a job from one company to another in IT consulting, it will be counted as a change in the above statistics. The figures for IT consulting are not surprising. Many people who enrol into an MBA program are from IT backgrounds, seeking an escape from the rigours of coding, and they often get placed in the same industry after graduation. This is followed by frantic efforts to change their fate, resulting in them leaving the industry.
What domains do most graduates enter after making the job change?
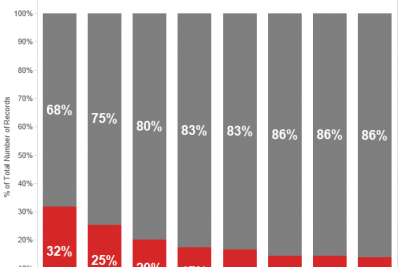
Again, the above graph only looks at the domain of the new job, and does not compare it with the domain of the old job. For instance, someone who entered a general management profile from another general management profile will be counted in the stats above. As you can see – 32% of those who are currently in general management, have changed jobs. The figure is high for technology firms as well. Looks like these are two domains where demand in the job market is high.
How many graduates have been changing their domains?
Roughly 40% of the graduates who changed jobs have changed their domain as well. This indicates that the career plans and aspirations of these graduates have changed drastically. Quite a large number of those changing jobs have changed the domains.
For graduates who are changing their domain, which domain are they entering?
And finally, the statistic that has been missing. This graph looks only at those graduates who changed domains, and reports which domain they entered. The size of the bubble is indicative of the number of graduates entering this domain. As you can see from above, most graduates have entered finance, general management and technology companies.
Other salient observations:
1. Relatively low rate of attrition in ISB: Candidates enter ISB with industry experience under their belt. They have a clearer idea of where they want to be after graduation. (also several years in one industry can narrow your options).
2. Very little attrition in front-end finance roles: This was a trend we observed last year as well. Job switches in finance have happened mostly in middle-office and corporate banking roles. Not surprising, because front end finance roles are high paying. The dream of doing something different tends to look less enticing when what you already have in hand is a front-end job in New York.
Other comments and definitions:
IT Consulting, Consulting, Technology: We have classified roles in Cognizant, Wipro and Infosys as IT consulting, roles in Deloitte, Ernst and Young, Accenture, McKinsey, BCG and Bain as Consulting, and roles in Microsoft, Google, Apple, Flipkart, Ibibo as technology. This classification explains some of the differences from last year’s data. As expected, there is less churn in consulting than in IT consulting. And there is great interest in technology firms.
You can write in the comments section in case you need any clarifications.
You may also want to read:
Last year's report on Job Switches in the batch of 2011.
Read all about our Recruiter Rankings from 2013 and 2012
here.


