Analytics is a rapidly growing market with organisations looking for talents across several domains such as engineers, MBAs as well as economics & statistic grads. Such a scenario enables one to work in a team with varied experience and backgrounds. Most organisations who used to earlier outsource major analytics work to pure-play analytics firms, today have in-house analytics teams as they prefer to keep critical data to themselves. Most top organisations such as Flipkart, Amazon, Walmart, Facebook have their own analytics team, which is increasing in great numbers. In addition, all the buzz words going around the market today are all to do with analytics, like, Data Mining, Big data, Text analysis are all integral to Business Intelligence in all fields of work, be it finance, marketing, operations and even HR.
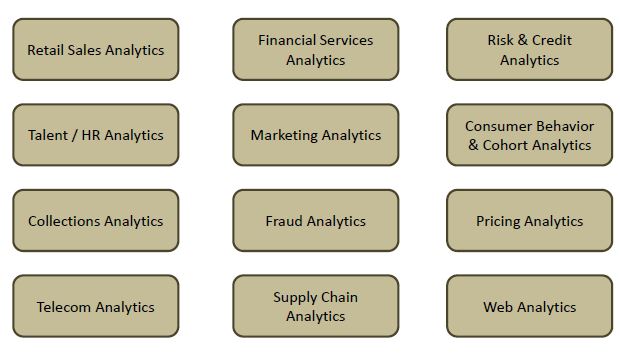
Different Domains for analytics:

So what makes one all set to wander into the analytics field?
Analytics generally preps us for answering the Why, What and How questions in an organisation. The why, results from the huge amount of data available to organisations today. The what, would be the ability to work with this huge amount of data, analyse and break it down into critical insights.
- Defining the current state: What problem the business is facing currently
- Defining the desired state: Where the business aspires to go by tackling the current issue
- Gap Identification: What is preventing the business from going from current to the desired state? This step involves the main crux of data analytics by collecting, cleaning and analysing the data. Several hypotheses are formulated as this stage.
- Evaluation of Hypotheses: Which is the right direction for the business to take, based on the evaluation of the multiple hypotheses.
- Story-boarding & Visualisation: How the conclusion can be presented to the client to make maximum impact.
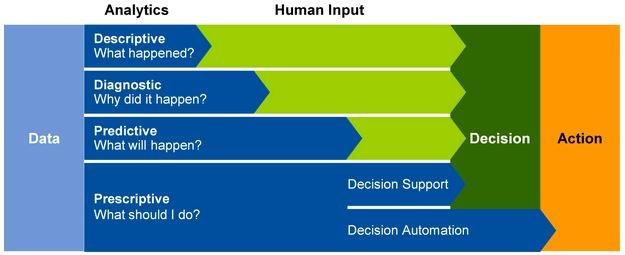
To carry out the said procedures, different forms of analytics are used:
- Descriptive – Provides an overview of what has happened in the business in the form of past data and takes the form of reports, flowcharts,
- Diagnostic/Inquisitive – Understanding why something has happened so far. This involves drilling into the data through methods such as regression, factor analysis, etc.
- Predictive analytics – This parts deals with, ‘what will happen’ in the future and involves a high analytics bent of mind to predict the future using data modelling and forecasting methods.
- Prescriptive analytics – The cream roles of analysts involves the part which answers, “What do we do then”, which is meant to tackle the predictions made and take the business to the top.

Tools:
Most form of analytics is done using proprietary software such as SAS and IBM SPSS. However, open source software such as R is being heavily used due to its ease of availability. While R and SAS are mostly used for Predictive Analysis, SQL and Teradata is more suited for smaller data pulls. Tableau is useful for data representation and good old Excel is handy for making quick dashboards.

Internship:
An internship is the best place to know if a particular field is really your cup of tea. Analytics with Fidelity Management and Research was something I was looking forward to from the day I converted the internship opportunity. Having pretty much no prior knowledge in the field of analytics, my internship gave me the opportunity to have a pretty much hands-on understanding and application of analytics during the 2 months. In addition, the great culture and constant support from the team at fidelity (also occasional team outings) were a great motivation to keep performing at the highest levels. A lot of training manuals are available online on MOOC platforms as well as on YouTube. If you love large pools of data and can visualise the potential it holds, then analytics is definitely the field for you!
_________
About the Author:

Aroop is the erstwhile coordinator of the E-cell at IIM Trichy and Sponsorship head at Dhruva '16. He interned at Fidelity Management and Research during his summer internship. He is a huge fan of Sarcasm, Surrealism and Soup.
