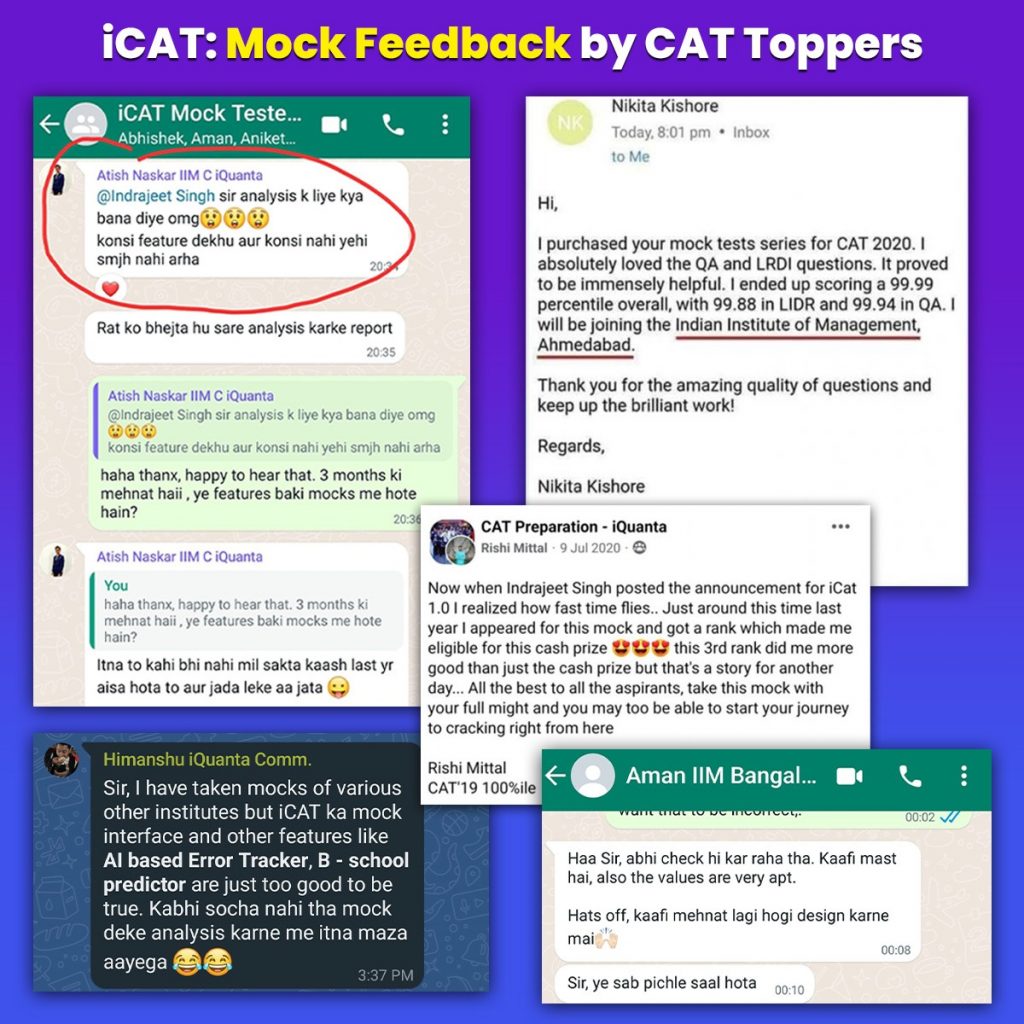
The A.I. Based CAT mock platform by iQuanta called iCAT seems to be one of the best in the market. First of all, when you log in to the mock platform, you'll be asked about your past academics, work-ex and other details. Set your target percentile and the B-school predictor tool will generate a list of B-schools you can get into.
Now comes the mocks. The interface has been built exactly like the CAT exam. The VARC section is good enough to match the past year's CAT exams. The RCs are a good mix of diverse genres, different lengths and cover all the varied subtopics relevant to the actual CAT exam. The Verbal Ability section is usually of Moderate to Difficult level and is in accordance with the latest pattern incorporating “Fill in the blanks” as well. The analysis part mentioning the difficulty level of the question helps you keep track of your trajectory. The DILR section is very good and the number of questions in each set brings out an element of surprise, sets are unique and the right set selection is of utmost importance, giving you the feels of an actual exam. The Quant section keeps in mind the distribution of questions across topics and at the same time, maintaining the apt difficulty of the section. This section has a mix of trick questions, time-consuming questions, and a few sitters as well. Overall the mock is very close to the actual CAT exam and helps you greatly to boost your preparation.
Once you're done with the test, you'll be redirected to the Analysis dashboard where you will be given a downloadable report for attempted, unattempted, skipped, correct, and incorrect questions. On this dashboard, you can perform an in-depth analysis by filtering your data section-wise, topic-wise or difficulty-wise.
Mock Analysis can take hours and multiple Excel sheets. To save this very crucial time right before the CAT exam, iQuanta's A.I. Based Mock Platform aims to reduce the analysis time by 60% through the error tracker where you'll have track of all the types of errors you made, in one place. This will give you details on what type of errors you are making in any particular topic or section. You can moreover select those types of questions, where you are making similar types of errors.
Next comes the goal Tracker which allows you to track your progress, compare your current mock performance with the metrics that you set in the Goal Setter and get a list of your weaker areas along with personalized corrective measures. It also provides a list of B-schools you hit or missed.
Now comes the Score Vs. Percentile. So what's different here is that the candidates are provided with proper score vs. percentile data according to the difficulty level of the mock.
Similarly multiple other features such as Mock Comparison where you can compare your performance between any of your two mocks, or with the topper's performance, and Analysis Across all mocks where you can keep track of all your mock performances are present.
Also, there are video solutions provided for each of the questions.

