
Question 1Multiple choiceMEDIUM
Question 1
The total sales (in Rs. million) in 2019 from products in office supplies category is closest to
Loading practice questions…
Loading question details…
Source: DI Topic Test 1
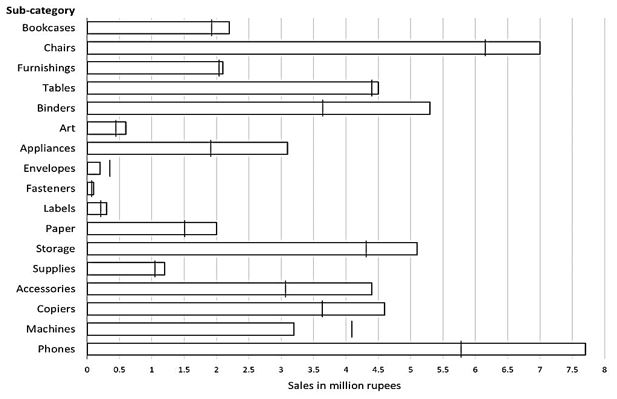 The horizontal bars in the above diagram represent 2020 aggregate sales (in ₹ million) of a company for the different subcategories of its products. The top four product subcategories (Bookcases, Chairs, Furnishings, Tables) belong to furniture product category; the bottom four product subcategories (Accessories, Copiers, Machines, Phones) belong to the technology product category while all other product subcategories belong to the office supply product category. For each of the product subcategories, there is a vertical line indicating the sales of the corresponding subcategory in 2019.
Learn more: CAT Data Interpretation questions with solutions
Practise more data interpretation questions